“Education” is Still on the Back-Seat: Current Status
Education is one of the eleven focus areas that Empower India Foundation has identified in which the Muslim community has to better its performance to reach on par with other communities in the country by the dawn of the second century of independence. This article discusses some key challenges based on official data, in the domain of that focus area.
Data gives insights where the policies, enactments and governance go wrong deviated from the Constitutional objective. Transparency and accountability being the basic premise of governance, any democratically elected government that refuses to adhere to this premise by default becomes an autocracy. Thus, data-based approach in evoking policies and budgeting to deal with challenges of governance will give tangible results in progressing the country. If any community/class wants to achieve progress this is the only means with vigilance on governance.
State of Education
Education is the primary skill to understand the dynamics of the society and that helps the individual to lead his life in a better way. It has been given place in the fundamental rights of our Constitution through Article 21A. The Right to Education Act was enacted to provide free and compulsory education to all children of the age of 6-14. In 2002, The Right to Education was given Constitutional status through the 86th amendment of the Constitution of India. But the ‘right’ was not supported by necessary budgetary allocation even after a decade. Thus, the country has higher illiteracy levels even after its implementation for more than a decade.
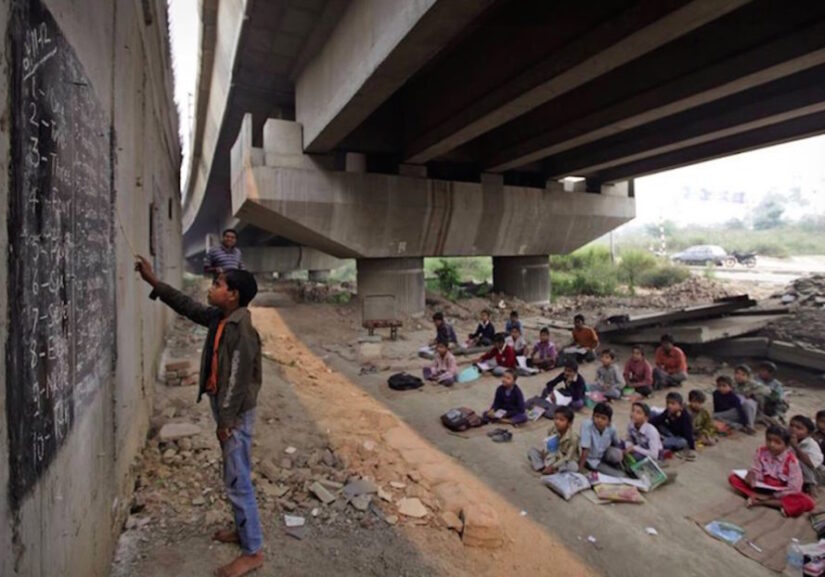
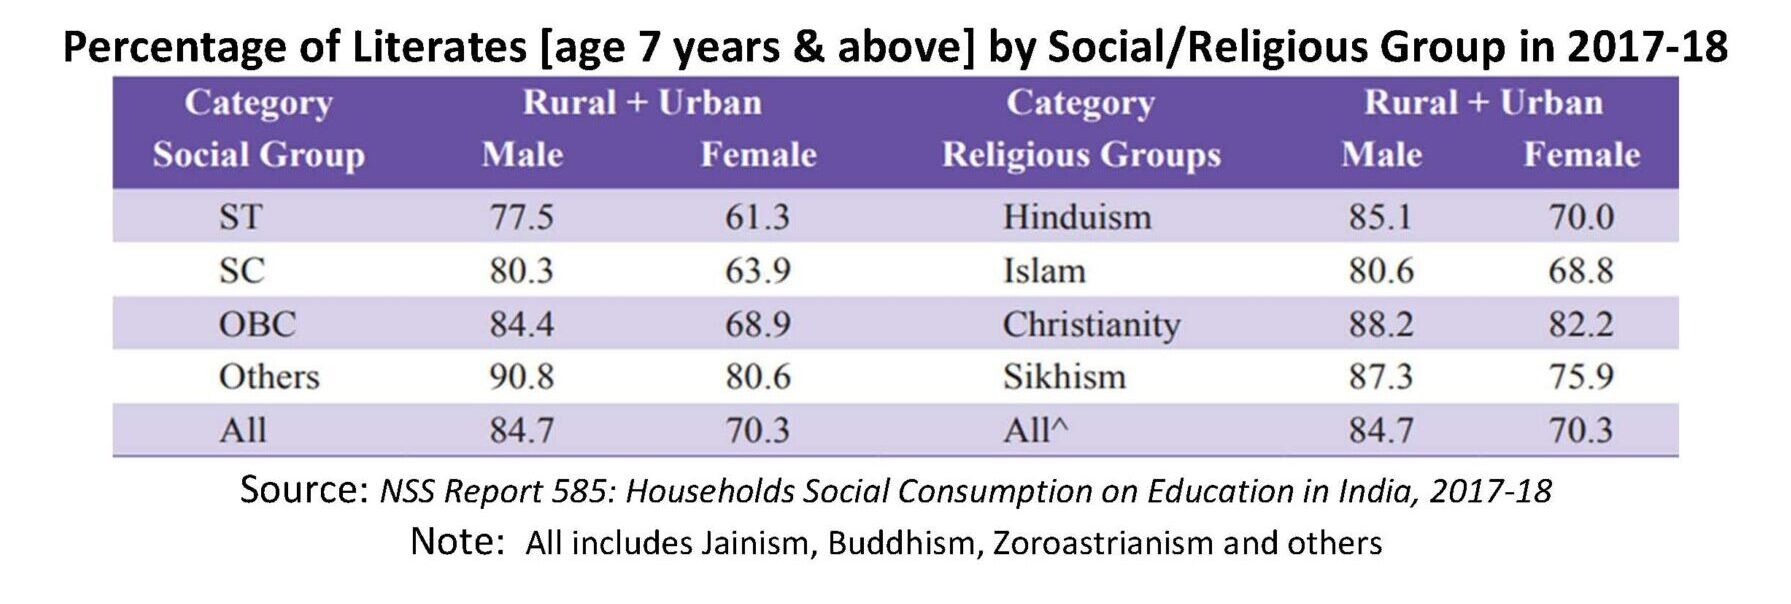
The definition of ‘Literacy’ in India carriers a fallacy that makes almost every Indian a ‘Literate’ with the ability to sign only, without being able to write, read and understand the local official language. This makes that particular ‘Literate’ ignorant of governance causing serious implications in his life. Muslim minorities are the prime victims of this concept of ‘Literacy’ followed by people of local languages like Bhojpuri, Maithili, Awadhi, Bagheli, Bundeli, Chhattisgarhi, Garhwali, Haryanawi, Kanauji, Kumayuni, Magahi, Marwari, etc. which are being treated as dialects of Hindi, which are actually not though. Same is the case with many of the tribal people. Density of schools in the habitations of these communities is very low and those have schools have several socio-cultural problems along with single teacher, absence of teachers, lack of amenities, prevailed discrimination, etc. causing a greater number of children to be out of school though they are officially enrolled resulting in the overall educational backwardness of these communities. Education at different levels is being affected by the present pandemic though it mandated global digital literacy programs and led to the demand for software explosion expected to drive IT employment from 4 million to 10 million. On the contrary, many studies show that the lack of physical interaction of students at primary level seems to have serious impact not only on learning skills but also in mathematical aptitude and understanding socio-cultural dynamics.
Primary Schools
There are 16,66,075 habitations as per 2011 census with 12.22 lakh elementary schools, 1.51 lakh of secondary schools and 1.33 lakh higher secondary schools amounting to a total of 15.07 lakhs. As per NCERT-AISES Report 2016[1] with the reference date of 30th Sep 2009, there are 11,37,833 habitations in the country out of which 10,37,833 habitations are with primary school facilities within one Km. There are 1,81,753 SC habitations in the country out of which 1,65,884 (91.27%) SC habitations have primary stage education facilities within a walking distance of one km.
There are the 1,98,493 ST habitations. Out of which 1,77,929 (89.64%) ST habitations have primary stage education facilities within a walking distance of 1 km. 93.12% of the habitations with 2000 above population have
Habitations with communities served with Primary Schools
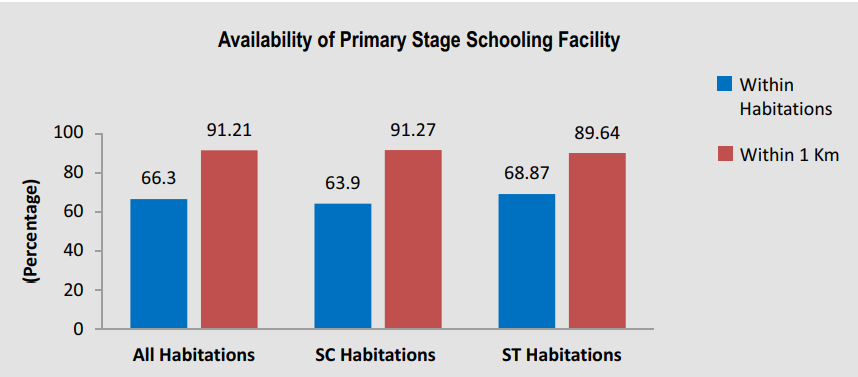
such facility in the habitation itself. In the case of SC habitations with 5,000+ population, the facility is 95.93%. While in the case of ST it is 99.51%. No such data in Muslim Habitations is available till date. Data of habitations with less than 50% of SCs and STs is not available. Given the caste prejudices, many of these communities along with some OBC communities are deemed to be deprived of primary educational facilities; even the absence of teaching staff and other amenities might have got reflected as illiterates in respective census periods.
Upper Primary Schools
There are 9,96,521 (87.58%) habitations with upper primary education facilities within three kms.; including 2,98,073 (26.20%) habitations having these facilities within the habitation itself. 82.25% habitations with more than 5,000 population have the facility within the habitation. 1,60,558 (88.34%) SC habitations have upper primary education facilities within a walking distance of three kms.; including 37,118 (20.42%) habitations that have these facilities within the habitations itself. SC Habitations with more than 5,000 population has 73.27% facility.
Habitations with communities served with Upper Primary Schools
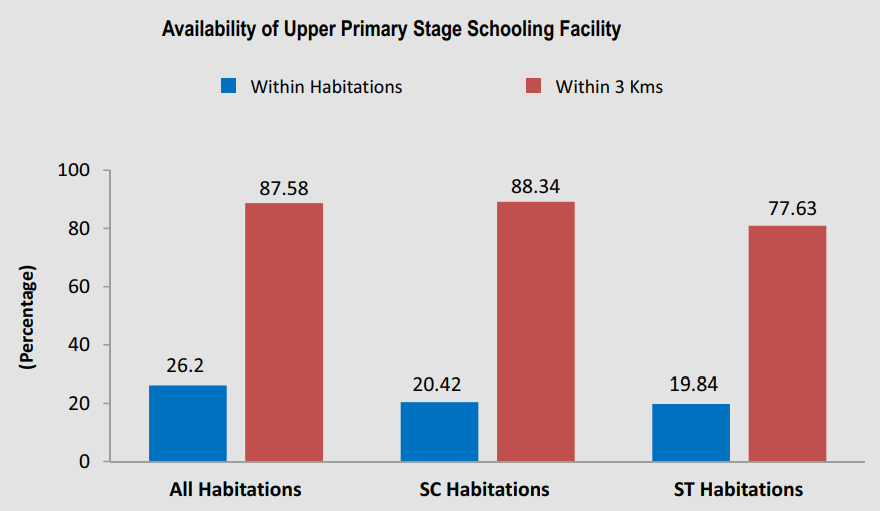
1,54,092 (77.63%) ST habitations have upper primary education facilities within three kms; including 39,374(19.84%) habitations having these facilities within the habitations itself. ST Habitations with more than 5,000 population has 81.98% facility.
Secondary Schooling
84.56% rural population has access to secondary education facilities within 5 kms; whereas 84.18% SC habitations and 65.62% ST habitations are having same facilities within a distance of 5 kms.
Higher Secondary
About 74.88% of rural habitations have the higher secondary stage education facilities within 8 kms, whereas 82.41% SC habitations and 54.96% ST habitations are having same facilities within a distance of 8 kms.
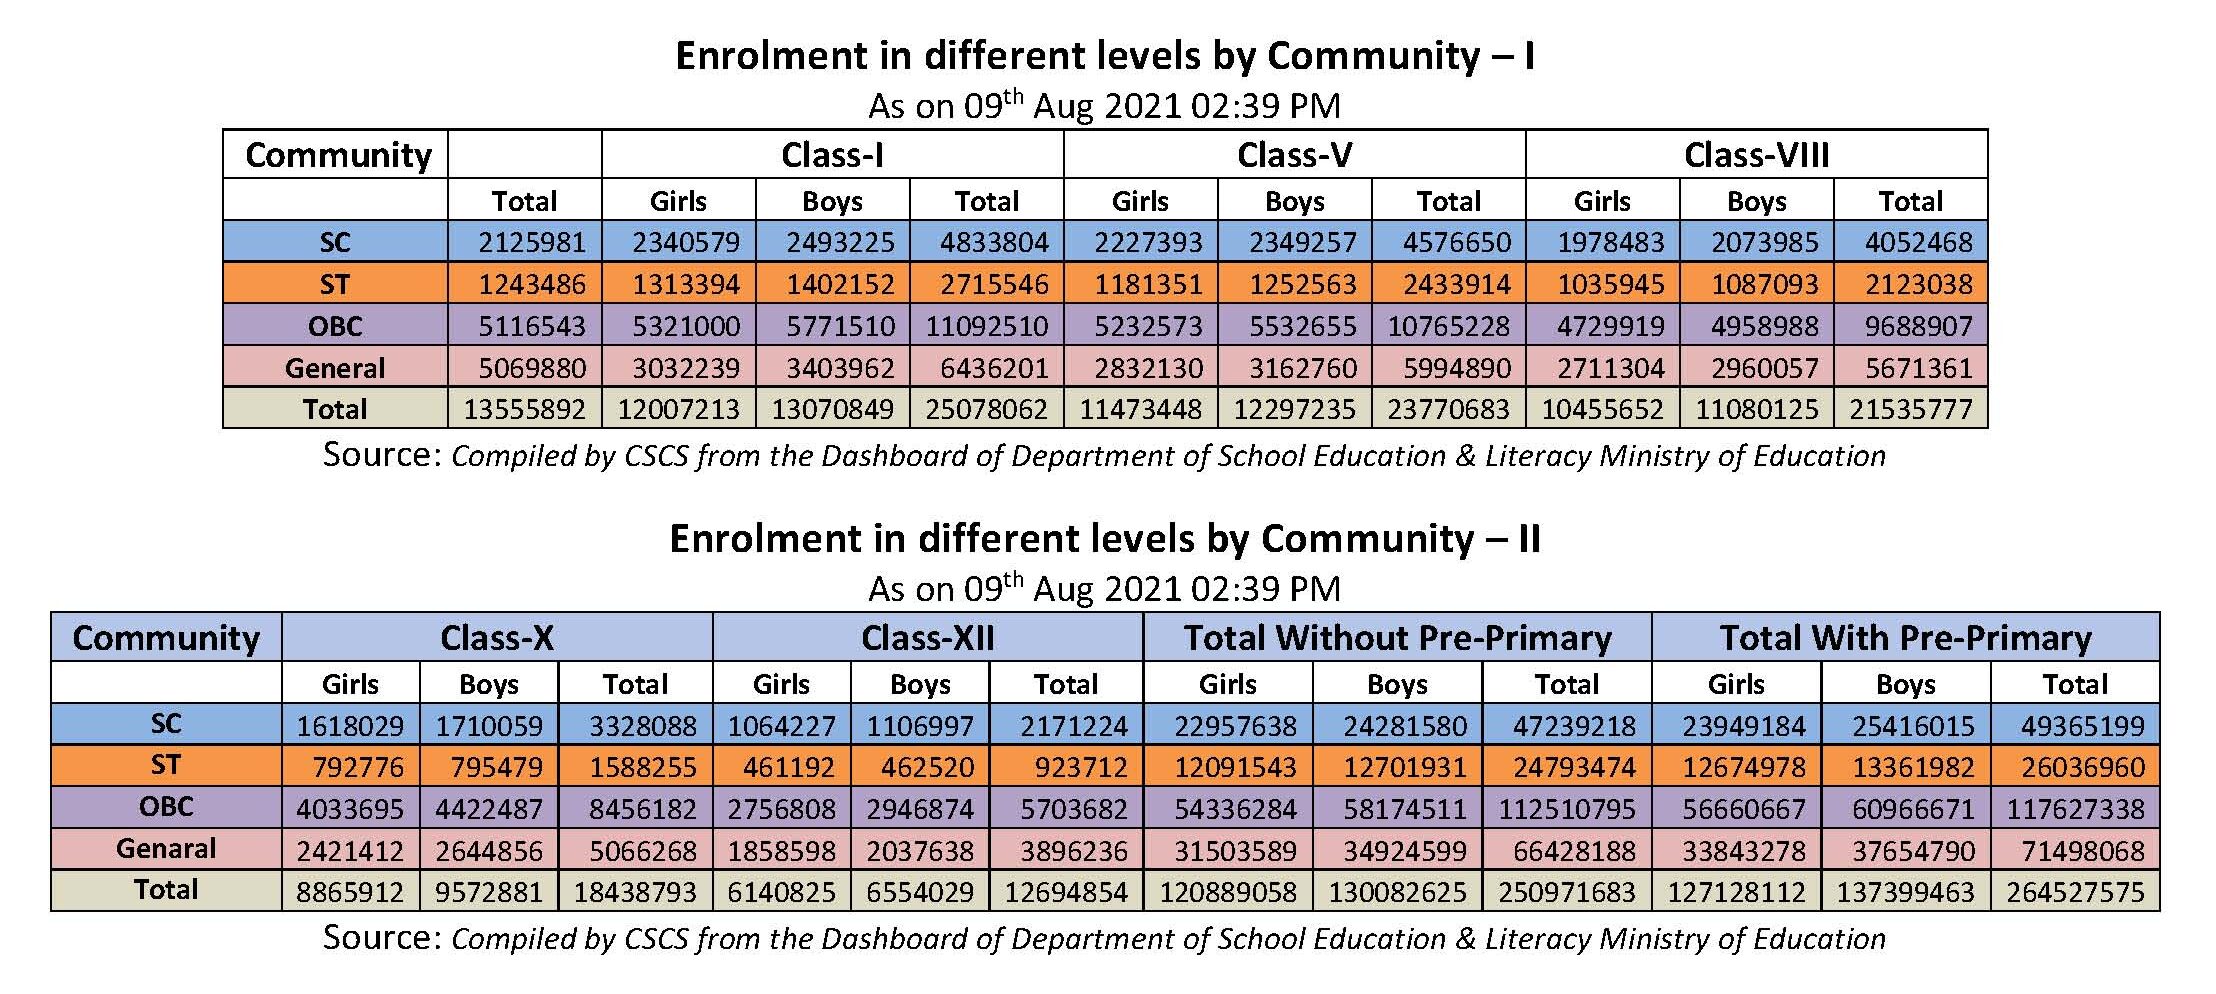
Enrolment
Enrolment at different levels of schooling by Department of School Education & Literacy Ministry of Education Dashboard.
The Dashboard doesn’t have the column ‘Muslims’, but has ‘OBCs’. There are 15,07,708 Schools with 96,87,577 Teachers catering to 26, 45, 27, 575 students in the year 2019-2020 as reported on 30th July 2021.
Enrolment details 2019-20
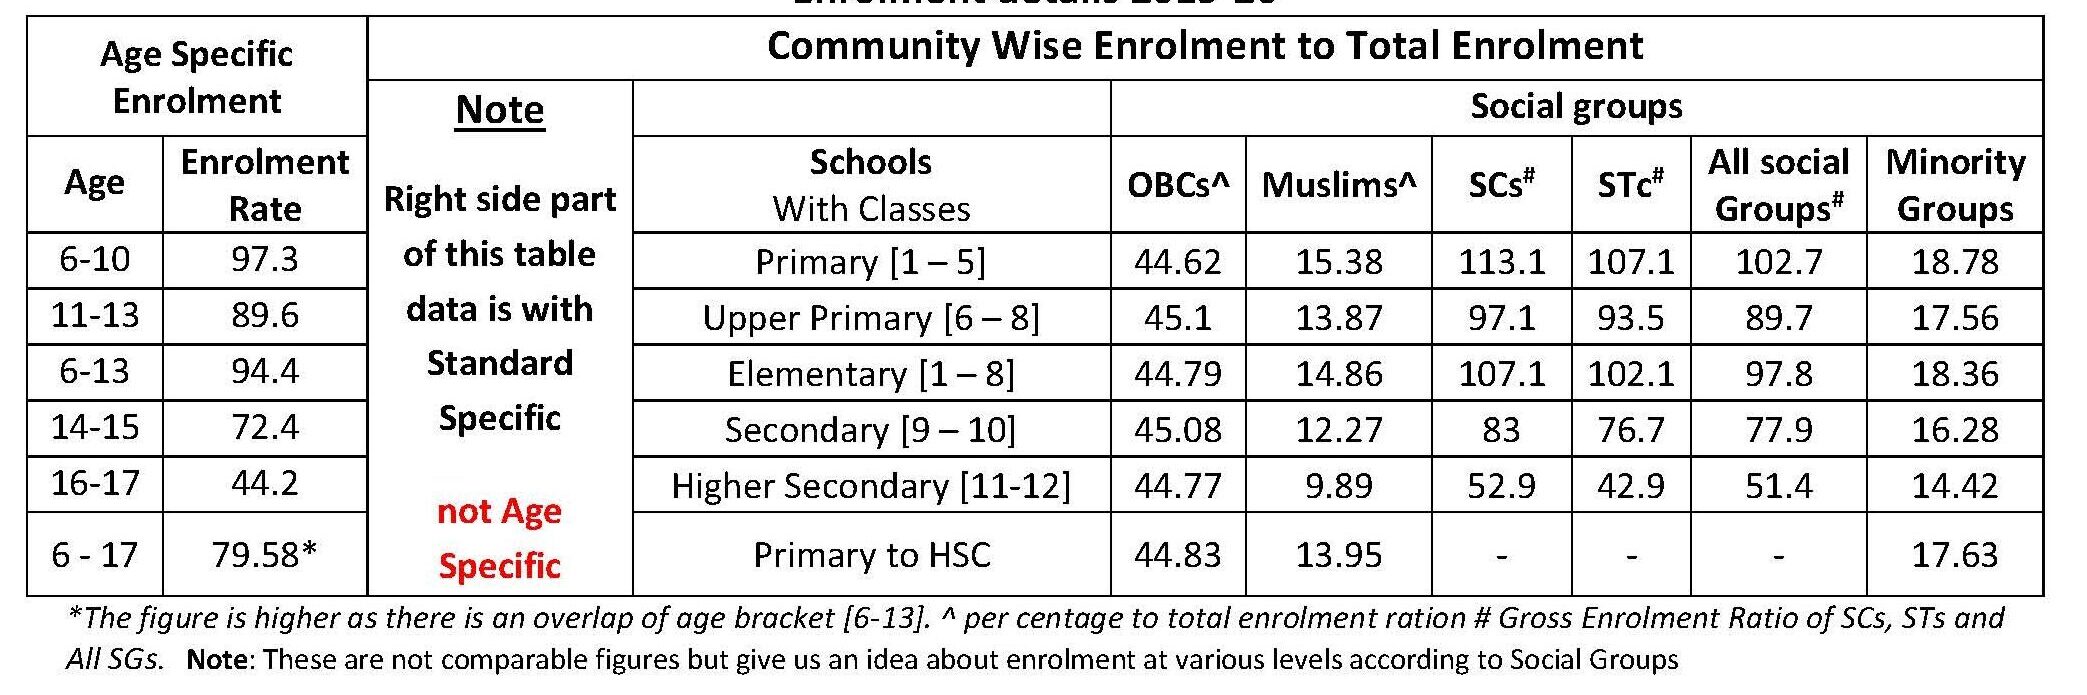 The Dashboard should have relevant age column from Census by that there will have data of how many of that age group are out of school or class, he or she is supposed to be. However, the UDISE report refers to ASER data that shows Age-Specific Enrolment Rate. Dropout rate is higher among Muslims followed by Adivasis and Dalits. The reasons for this need to be studied at micro level, however, acute poverty and not having affirmative support on par with SCs and STs might be one reason. The financial eligibility of scholarship scheme differs from community to community and the logic for that is a paradox in itself. Many of the Muslim children in the financial eligibility criteria feel that, the hardships they undergo to tap the scholarship is not worth it.
The number of habitations not having school facilities, though eligible, was not available; likewise the habitations less than 50% population norm of SCs, STs are also not available. However, overall Census data tabulated in Educational Level as per Census 2011 C-8SC, C-8ST, C-9 Tables in this paper reflects the level of education achieved by SC, ST and Muslim communities. It might be one of the reasons for having higher number of Madrasas in Muslim concentrated areas of Hindi belt. Sachar Committee Report also noted that these Madrasas served non-Muslims. Whereas the data of Muslims at habitation level is absent, their educational levels are more or less on par with SCs. SCs and STs could not excel despite reservations in educational institutions, is the result of failure of successive governments in facilitating necessary infrastructure and administrative support along with meeting the challenges of socio-cultural dynamics; it is not the of failure of the reservation policy. In the case of Muslims, it is complete discrimination other than the variables that influenced SCs and STs in the absence of reservation. Community specific education data at habitation level is needed to meet the requirement of OBC, SC, ST and Minority Commissions’ mandate. Census schedules need to make necessary changes to meet this requirement. Community leadership and intelligentsia should debate this issue and make the policy making bodies to amend the statutes to overcome the gaps of educational backwardness.
Minority-Managed Schools
There are 42,548 schools in the country managed by different religious minorities in 2009 as per the NCERT AISES Report 2016. Out of this, 51% is Muslims; 4% Sikh; 1.43% Jain; 37.06% Christian; 0.17% Parsi; 0.32% Neo-Buddhist and 5.86% managed by other religious minorities. The category-wise distribution is 50.58% primary; 26.64% upper primary; 14.46% secondary and 8.33% higher secondary[2].
UDISE+ 2019-2020 Report doesn’t have any data on minority-managed schools. AISES-8th [2016] Round Report with NCPCR 2021 report data was compared. It was observed that Muslim community is drifting away from managing educational institutions guaranteed under Articles 29 and 30 of the Constitution. Their share has fallen from 51% in 2009 to 22.75% and even in this 22,75% many schools belong to Muslims for name-sake.
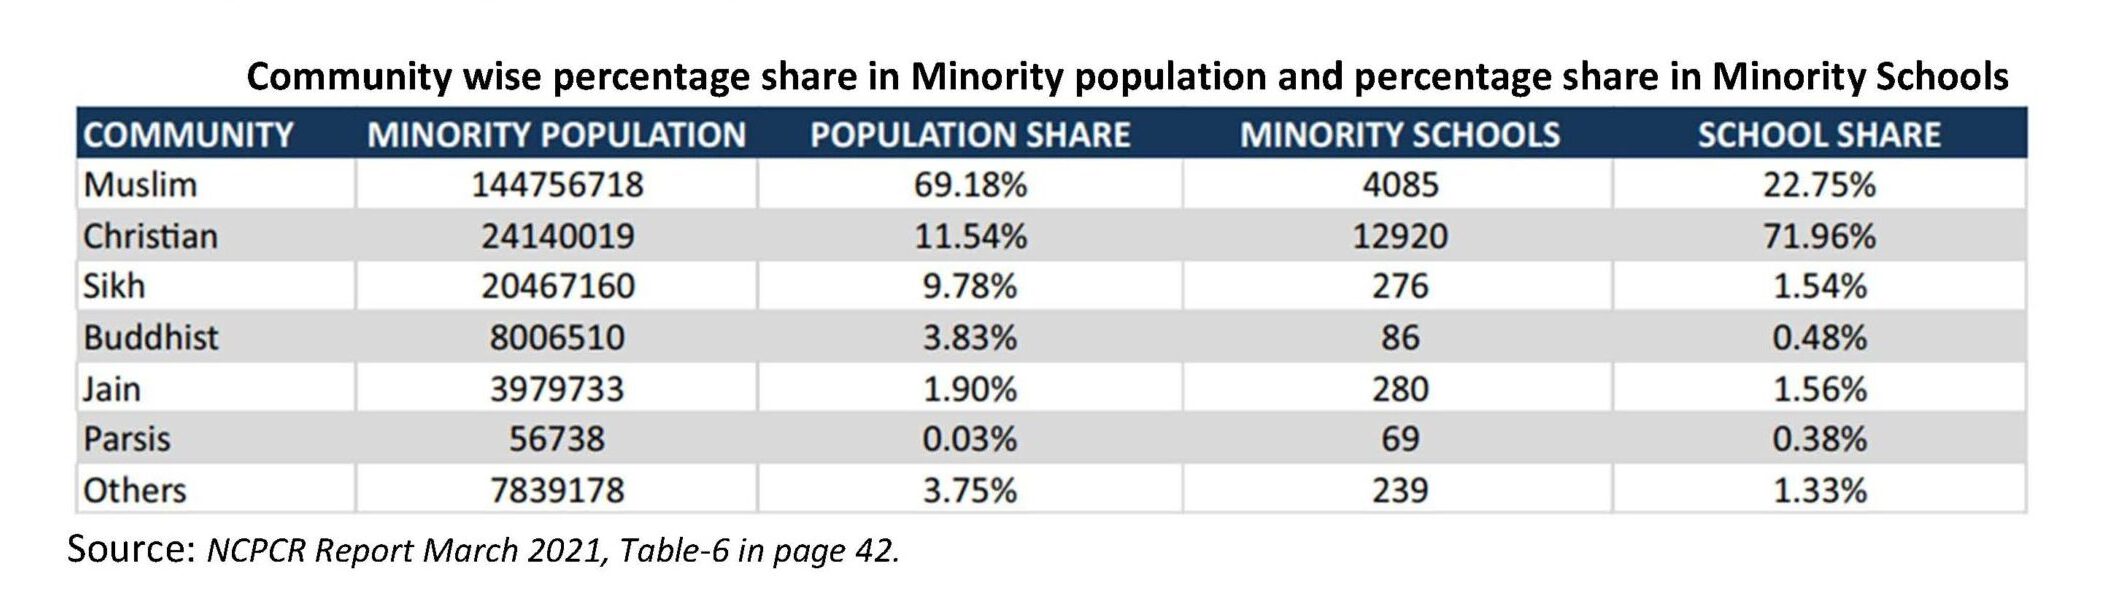
Recently released “IMPACT OF EXEMPTION UNDER ARTICLE 15(5) W.R.T. ARTICLE 21A OF THE CONSTITUTION OF INDIA ON EDUCATION OF CHILDREN OF MINORITY COMMUNITIES” by National Commission for Protection of Child Rights Report identifies 23,487 minority schools across India (see the table above).
In between the period of these two reports 19,061 Muslim-community-managed schools were missing. Other details of the share of minority schools of the period were shockingly dwindled. The causes for this need to be studied beyond the change of ruling regimes in States and Center. The policies adopted by the change of regime would have definitely impacted this but, how the Constitutional guarantee to the managements of these institutions failed to protect them should be checked going through different court judgements on the subject. How the Courts and administration precepted and interpreted the Constitutional guarantee read with 86th Constitutional Amendment and RTE Act is in itself a major study. The NCPCR in its 2021 March report[3] raises many questions that by default envisages to reboot Constitutional protection to minority institutions under Article 29 and 30. NCPCR refers to the amendment to the RTE Act of 2012, section 12[1] that has exempted minority religious education institutions for this purpose as ultra vires Article 15. It further argues that minority institutions are violating child rights and not serving the objective for which the Constitutional protection is given to them. This is a silent encroachment on minorities aimed to do away with Constitutional protection. The limitations of this paper don’t allow the author to analyze the subject further. Many such attempts by the authorities and courts in this period might have made the minority managements to shut down their institutions.
- The report finds 1.1 crore children of Muslim Community are either out of school or not enrolled in the age group of 6-14 out of 3.8 crore total children. The Muslim community contributes a share percentage of 69.18% to the religious minority population, and contributes a share of 22.75% to the religious minority schools. Their literacy rate stands at 59.1 as per 2011 Census.
- The Christian community, which makes up 11.54% of the total religious population, has a share of 71.96% of the total religious minority schools in India. Their literacy rate stands at 80.3 as per 2011 Census.
- The Sikh community contributes a share percentage of 9.78% to the total religious minority population, and contributes a share of 1.54% to the religious minority schools. Their literacy rate stands at 69.4 as per 2011 Census.
- The Buddhist community, which makes up 3.38% of the total religious population, has a share of 0.48% of the total religious minority schools in India. Their literacy rate stands at 72.7 as per 2011 Census.
- The Jain community contributes a share percentage of 1.90% to the religious minority population, and contributes a share of 1.56% to the religious minority schools. Their literacy rate stands at 94.1 as per 2011 Census.
- The Parsi community, which makes up 0.03% of the total religious population, has a share of 0.38% of the total religious minority schools in India.
- Others religious communities (including tribal religions, Bahai, Jews), contribute a share percentage of 3.75% to the religious minority population, and contributes a share of 1.33% to the religious minority schools.
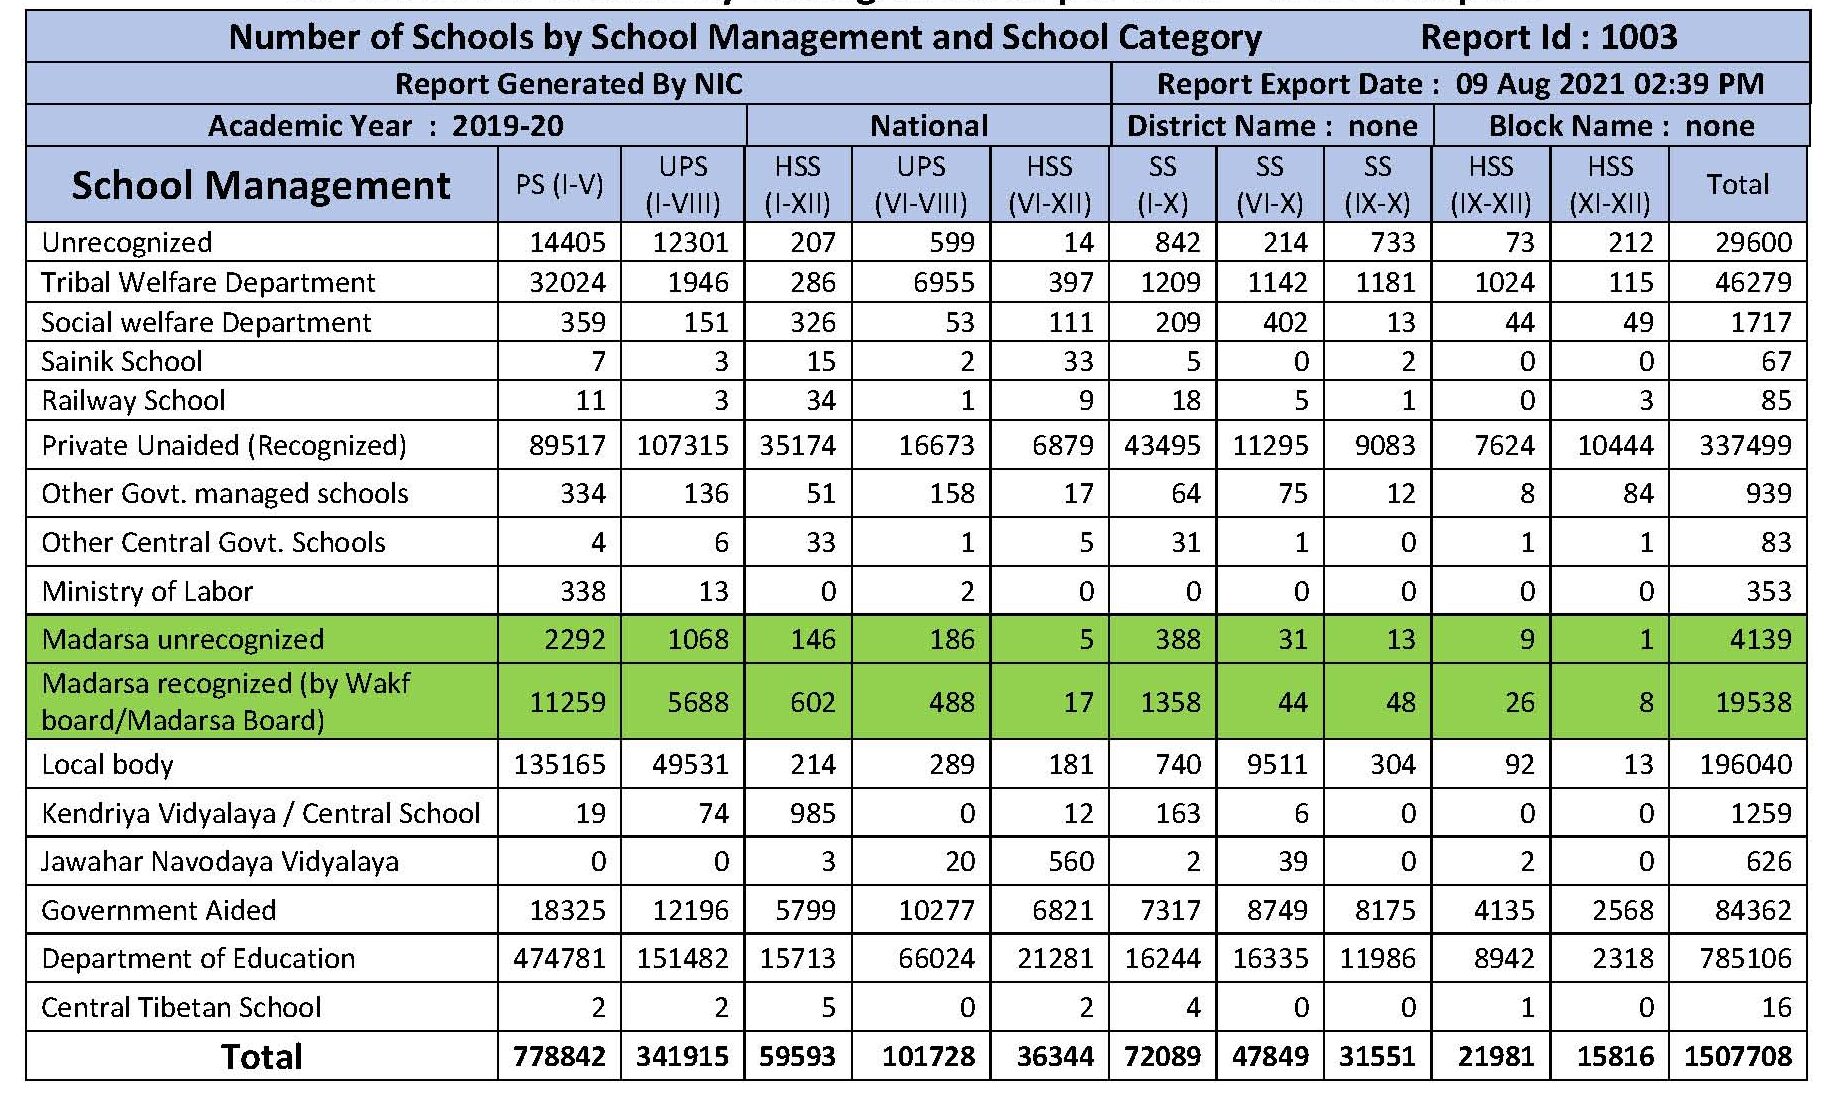
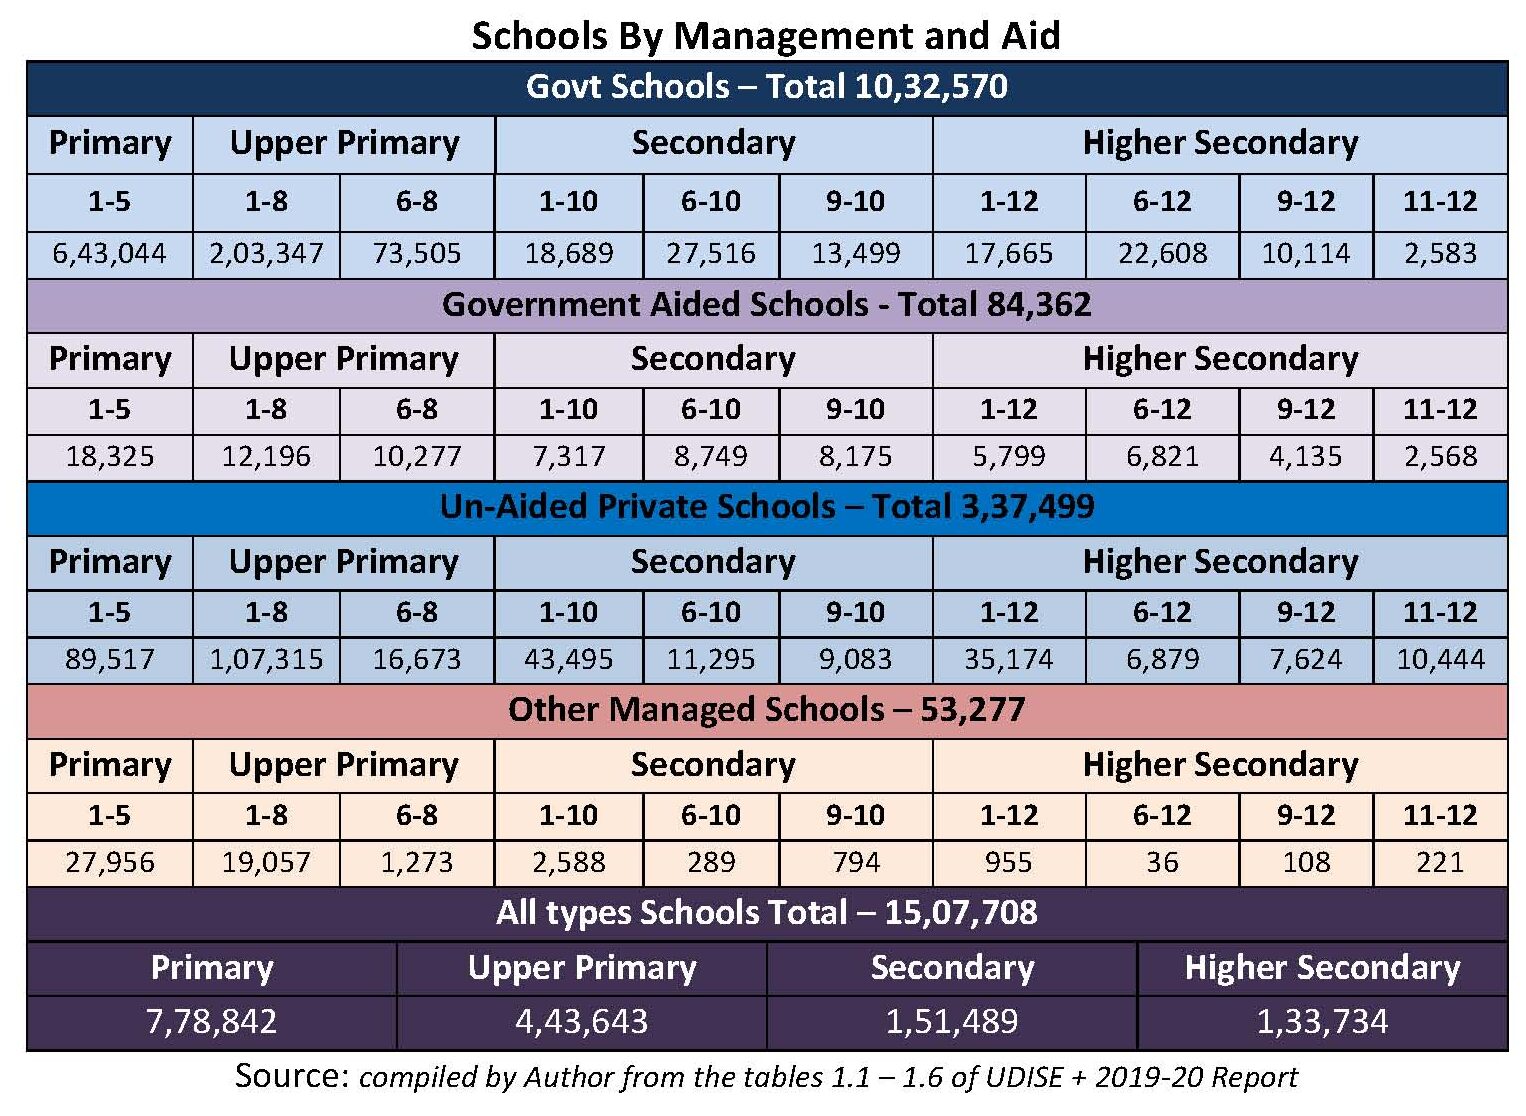
No of Schools in India by Management as per UDISE 2019-20 Report [4]
The comparative data with the UDISE 2019-20 report with 8th AISES- A Concise Report[5] shows that the government slowly began to privatize education at all levels. The number of private unaided schools is 13% [1,74,948], private aided are 7% [ 87,598] as per 8th AISES- A Concise Report. The following table titled Schools by Management and Aid give us an idea of how the shift to privatization is happening. The percentage of private unaided schools gets increased as the education level goes up. At secondary level in 2009, there were 32.81% private-aided and 33.31% private-unaided schools. Between 2010-11 and 2015-16, private school enrollment rose by 17.5 million and government schools lost nearly 13 million children. The massive exodus of students from government schools has resulted in the growth of small and tiny schools (in terms of enrolment) in both urban and rural areas. In 2016-17 about 28% of India’s public primary schools and 14.8% of India’s upper primary schools had less than 30 students, according to UDISE (Unified District Information System for Education) data.
That resulted in zero enrolment in many schools. The fall in the quality of education in government schools is one reason for this. More than 10% of the schools (1.19 lakh) have a single teacher, with the majority being primary schools. Appointment of contract teachers, in place of sanctioned teachers’ posts, keeping teacher posts vacant for several years is forcing the students to shift themselves to private schools. The year 2018-19 saw 11.7% vacancies against the sanctioned posts of teachers, of the 17,64,956 posts of teachers under the Samagra Shiksha, 19.1% was vacant and 8.8% of teacher posts under state and union territory governments were vacant. Hindi-belt states suffer highest shortage of subject teachers in secondary level. The number of contract teachers in India’s education system has steadily grown from 3,16,091 at the elementary level in 2010-11 to 6,32,316 by 2017-18 at the elementary and secondary levels. Government on one hand amends the Constitution to provide Right to Education, contrary to that, it facilitates the growth of private schools. Thus, drifting away from the Constitutional obligation by adopting different means. Rationalization of government school program under Sarva Siksha Abhiyan [old name ofSamagra Shiksha] is such an example by which many of the schools were merged depriving habitations from school facility in reach. Governments withdrawing aid to different managements, increase the number of unaided schools and private schools. Thus, Government of India and the State Governments are moving away from the mandated Right to Education slowly.
Over the decades, literacy rates had shown substantial improvement. The total literacy rate, which was only 16.67 percent in 1951 rose to 73 percent in 2011. During the period 1950-51 to 2018-2019[6], the number of primary schools has increased from 2,10,000 in 1950-51 to 8,27,028 in 2018-2019 whereas the number of upper primary schools increased by about 15 times from 13,600 in 1950-51 to 4,43,379 in 2018-2019. The total number of teachers increased from 6,24,000 in 1950-51 to 15,03,156 in 2019-2020[7]. The number of female teachers increased from 95,000 in 1950-51 to 6,38,841 in 2019-2020[8]. Out of the Total teachers 5.6% belongs to Muslims, 9% SCs, 2.4% STs, 32.1% OBCs and 9% from other minority groups.
Higher Education
There are 1,043 Universities, 42,343 Colleges and 11,779 standalone institutions listed on AISHE web portal. Out of them 396 Universities are privately managed. 420 Universities are located in rural areas. 17 Universities are exclusively for women, 3 in Rajasthan, 2 in Karnataka and 1 each in Tamil Nadu, Andhra Pradesh, Assam, Bihar, Delhi, Haryana, Himachal Pradesh, Maharashtra, Odisha, Uttarakhand and West Bengal. One Central Open University, 14 State Open Universities and one State Private Open University are in operation. There are 110 Dual Mode Universities, which offer education through distance mode also, 13 of them are located in Tamil Nadu.
There are 522 General, 177 Technical, 63 Agriculture & Allied, 66 Medical, 23 Law, 12 Sanskrit and 11 Language Universities and 145 Universities of other Categories. The top 8 States in terms of highest number of colleges in India are Uttar Pradesh, Maharashtra, Karnataka, Rajasthan, Andhra Pradesh, Tamil Nadu, Madhya Pradesh and Gujarat. Bangalore Urban district tops in terms of number of colleges with 1,009 colleges followed by Jaipur with 606 colleges. Top 50 districts have about 32% of colleges. College density, i.e. the number of colleges per lakh eligible population (population in the age-group 18-23 years) varies from 7 in Bihar to 59 in Karnataka as compared to all India average of 30. 60.56% colleges are located in rural areas. 10.75% colleges are exclusively for females. Only 2.7% colleges run Ph.D. programs and 35.04% Colleges run Post Graduate level programs. There are 32.6% colleges, which run only single programs, out of which 84.1% are privately managed. Among these privately managed colleges, 37.4% colleges run B.Ed. courses only. 78.6% colleges are privately managed; 65.2% private-unaided and 13.4% private-aided. Andhra Pradesh and Telangana have about 80% private-unaided colleges and Uttar Pradesh has 78.5% private-unaided colleges, whereas, Chandigarh has 8.0%. 16.6% of the colleges have enrolment less than 100 and only 4% colleges have enrolment more than 3,000.
Total enrolment in higher education has been estimated to be 38.5 million with 19.6 million boys and 18.9 million females. Females constitute 49% of the total enrolment.
- Gross Enrolment Ratio (GER) in higher education in India is 27.1, which is calculated for 18-23 years of age group. GER for male population is 26.9 and for female, it is 27.3. For Scheduled Castes, it is 23.4 and for Scheduled Tribes, it is 18.0 as compared to the national GER of 27.1.
- Distance enrolment constitutes about 11.1% of the total enrolment in higher education, of which 44.5% are female students. About 79.5% of the students are enrolled in undergraduate level programs. 2,02,550 students are enrolled in Ph.D. which is about 0.5% of the total student enrolment.
- Maximum numbers of students are enrolled in B.A. programs followed by B.Sc. and B.Com. programs. 10 Programs out of approximately 196 covers 79% of the total students enrolled in higher education.
- At undergraduate level, the highest number 32.7% of students are enrolled in Arts/Humanities/Social Sciences courses followed by science 16%, Commerce 14.9% and Engineering and Technology 12.6%.
- At Ph.D. level, maximum number of students are enrolled in Engineering and Technology stream followed by science. On the other hand, at Post Graduate level maximum students are enrolled in Social Science stream and Science comes at number two.
- Uttar Pradesh comes at number one with the highest student enrolment followed by Maharashtra and Tamil Nadu.
- Scheduled Caste students constitute 14.7% and Scheduled Tribes students 5.6% of the total enrolment. 37% students belong to Other Backward Classes. 5% students belongs to Muslim minority and 2.3% from other minority communities.
- There are more than 78.6% colleges running in private sector; aided and unaided taken together, but it caters to only 66.3% of the total enrolment.
- The total number of teachers are 15,03,156, out of which about 57.5% are male teachers and 42.5% are female teachers. At all India level, there are 74 female teachers per 100 male teachers.
- Pupil Teacher Ratio (PTR) in universities and colleges is 28 if regular mode enrolment is considered whereas PTR for universities and its constituent units is 18 for regular mode.
- Among non-teaching staff, the share of Group-C is the highest with 40.1%, followed by Group-D with 27.7%. Group-A and Group-B comprise 15.1% and 17.2% non-teaching posts respectively.
- The average number of females per 100 male non-teaching staff is 51. 38,986 students were awarded Ph.D. level degree during 2019 with 21,577 males and 17,409 females.
- A (20.3 lakh) degrees has been awarded to maximum number of students. B.Sc (10.6 Lakh) is the second highest followed by B.Com (9.3 Lakh).
- At Post Graduate level M.A. pass number of students is maximum followed by M.Sc. and M.B.A.
- The highest number of students (20.7 Lakh) have graduated in Arts courses.
- At Ph.D. level, maximum number of students out-turn is in science stream followed by Engineering and Technology. On the other hand, at PG level maximum students out-turn is observed in Social Science and Science stream comes at number two.
- The share of Ph.D. student is the highest in State Public University (29.8%) followed by Institute of National Importance (23.2%), Deemed University-Private (13.9%) and Central University (13.6%).
Educational Budgeting
The share of education in the total Union budget is continuously decreasing. The total school education budget for the Financial Year [FY] 2021-22 is Rs.54,874 crores. Of this, Rs 44,000 crores is coming from Education cess and Rs. 4,800 from the National Investment Fund. This implies that, over time, the gross budgetary support for education is declining and the fate of allocation of the sector depends on cess collection and disinvestment proceeds. These allocations and spending are not compatible with the policies of the GOI itself, even the newly adopted National Educational Policy [NEP] is not supported by the allocations of FY 2021-’22. Still sloganeering and hype through advertisement continue to grow, while much of taxpayers’ money is diverted to crony-corporates under various provision of law and GOI is not hesitating to make new enactments to facilitate fund flow for them.
Union Government’s Budgetary Spending on Education as share of GDP [9]
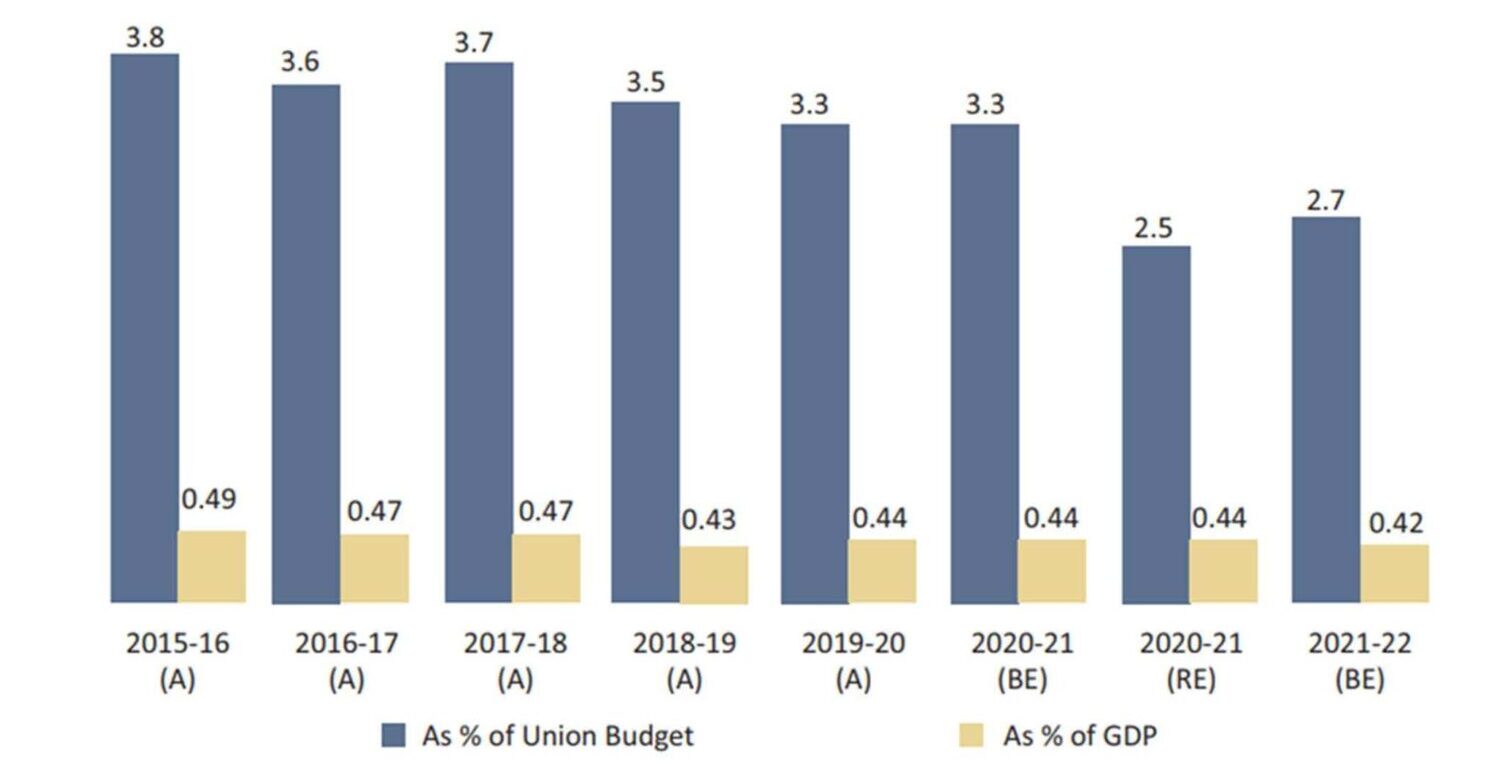
Notes: GDP figures at current market price (2011-12 series), the 2020-21(BE) figures for GDP are the earlier projection figure kept unchanged for parity.
This continuous budgetary slash in the last 7 years is a clear proof of state moving away from Constitutional mandate beyond the hype it is creating in the social mindset.
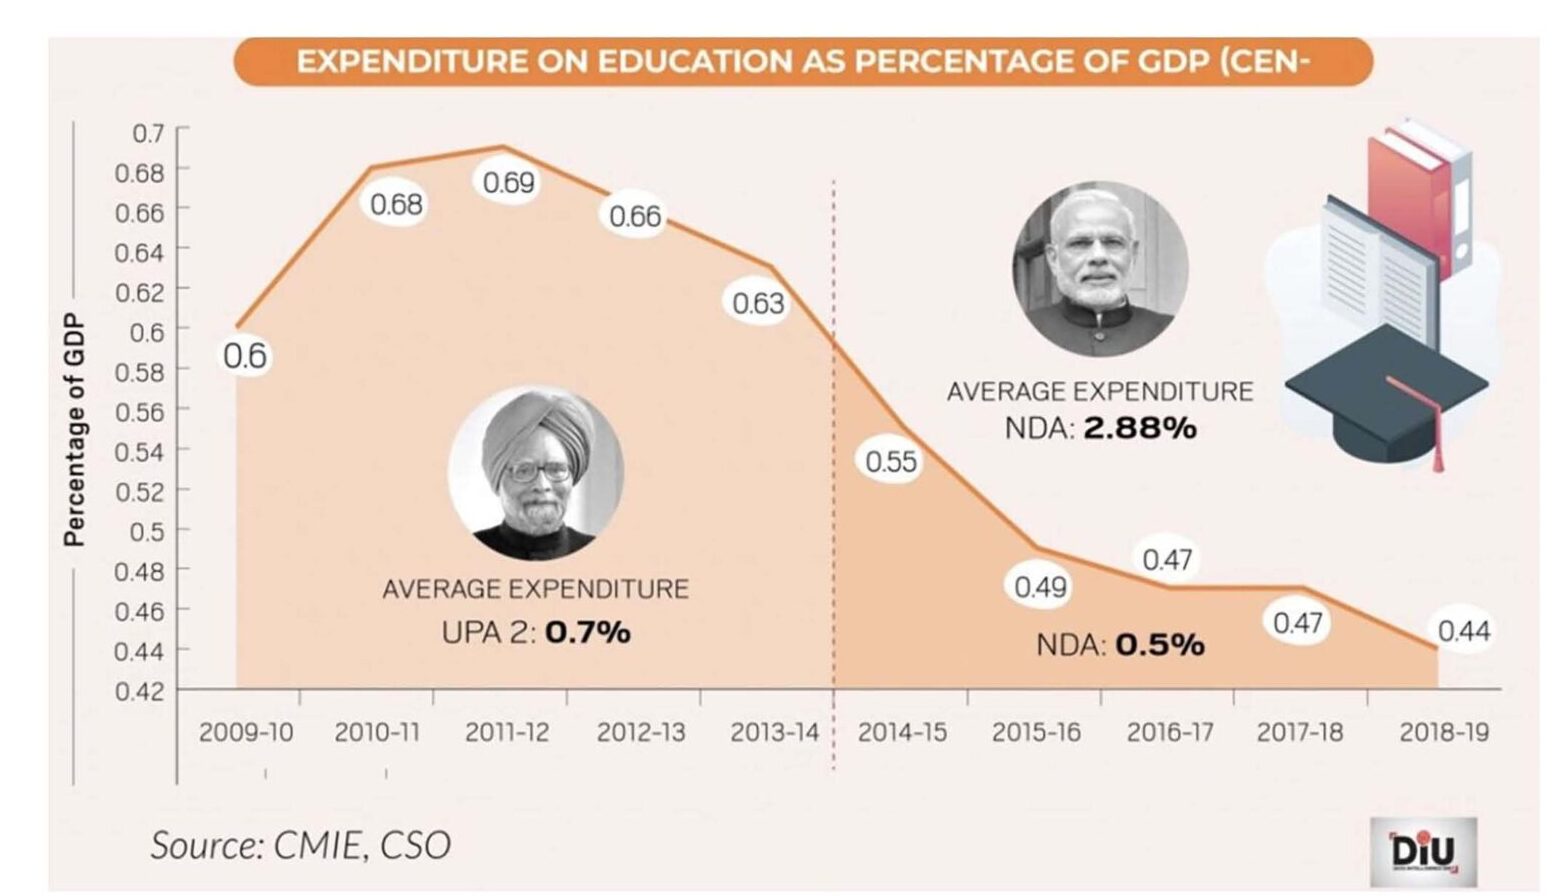
The following picture illustrates what has been done to education in comparison of UPA-2 with NDA-2
 In all the budgets from 2016 to 2019; Budget 2016-17 is ₹ 72,394 crore, Budget 2017-18 is ₹ 79,685.95 crore, Budget 2018-19 is ₹ 85,010 crore, Budget 2019-20 is ₹ 94,854 crore. The budget percentage was in the range of 3 to 4.6 percent of GDP. One can see that India’s expenditure on education has been increasing in terms of allocation in the last five years but not relative to the of share in GDP. However, according to the government Niti Aayog, India should increase the education expenditure to nearly 6 per cent of the GDP over the next two years.
However, budget spending on education remained 3.1% of GDP. As a result, India’s rank in Human Development Index (HDI) was 131 in 2019, compared to 129 in 2018, out of a total 189 countries according to UNDP Human Development Report, 2020. It may be mentioned that the decline in HDI ranking by two points in 2019 as compared to 2018 is relative to other countries. The age-wise census tables on various communities give us better idea of how the spending on education impacted us.
Dropout Rates
As per Unified District Information System for Education (U-DISE) (provisional) 2017-18, the annual average dropout rate at primary, upper primary and secondary level was 3.5%, 5.02% and 18.96% respectively.
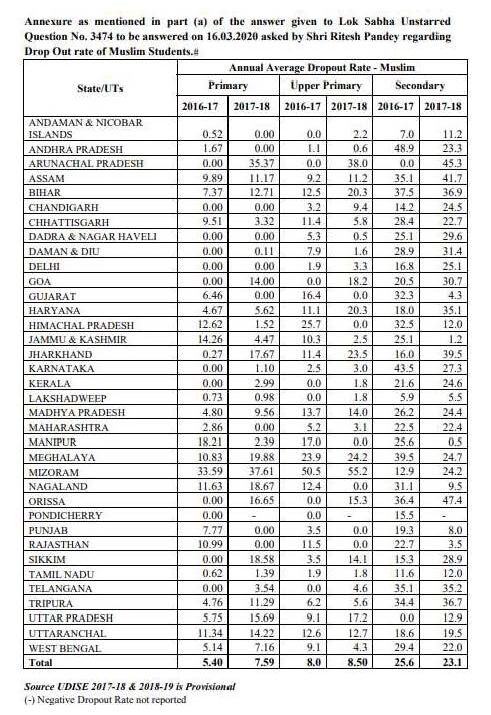
As per U-DISE 2017-18, the annual average dropout rate for Muslims at primary, upper primary and secondary level was 7.6%, 8.5 % and 23.1% respectively, whereas for Scheduled Caste at primary, upper primary and secondary level it was 4.9%, 6.6% and 21.8% respectively and for Scheduled Tribe at primary, upper primary and secondary level it was 3.7%, 6.1% and 22.3% respectively[10]. Muslim Specific Dropout rate data with state-wise details was made available from 2017-2019 in response to the question no 3474 in Loksabha on 16-03-2021 pasted below. It is interesting to note that by secondary level, the dropout level is higher and the gap is being reduced over the years. However, given the state of vacancies in government schools, affordability in private schools, the data is questionable not only in case of Muslims but also in case of other poor communities like SCs, STs and OBCs.
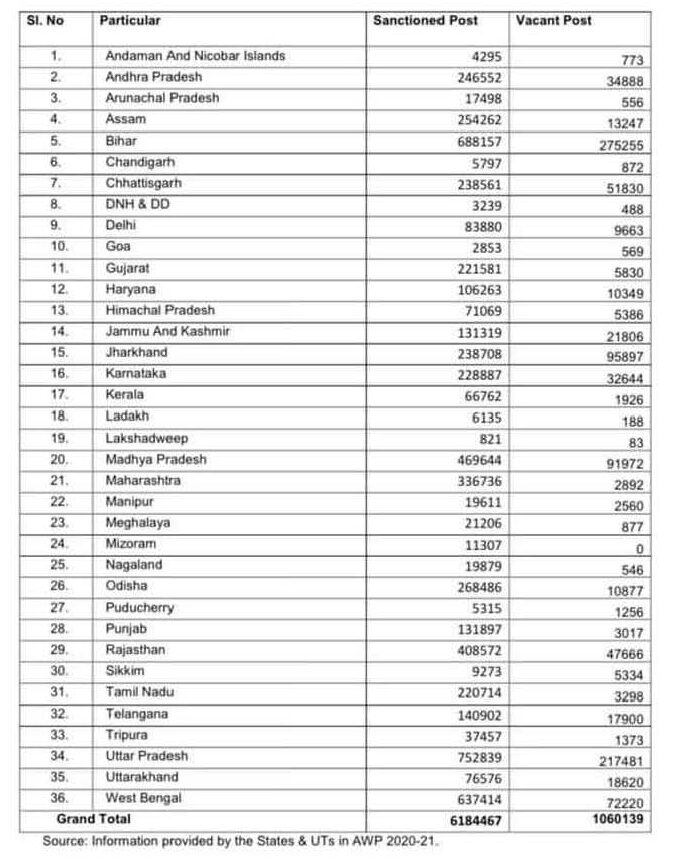
Vacancies in Educational Sector
There are total of 61.8 lakh sanctioned posts in government schools in which 10.6 lakh teaching post are vacant all over India. Bihar has the largest number of vacant posts in government school which is 2.7 lakhs. Vacant teaching posts in Uttar Pradesh are 2.1 lakh. The data collected from different states Annual Work Plan of HRD Ministry in 2020-2021 is tabulated below.
Status of vacant posts of teachers in government schools 2020-2021
Education Minister replied in LS that OBC’s 55%, SC’s 38.71% and ST’s 41.64% posts are lying vacant in central universities.
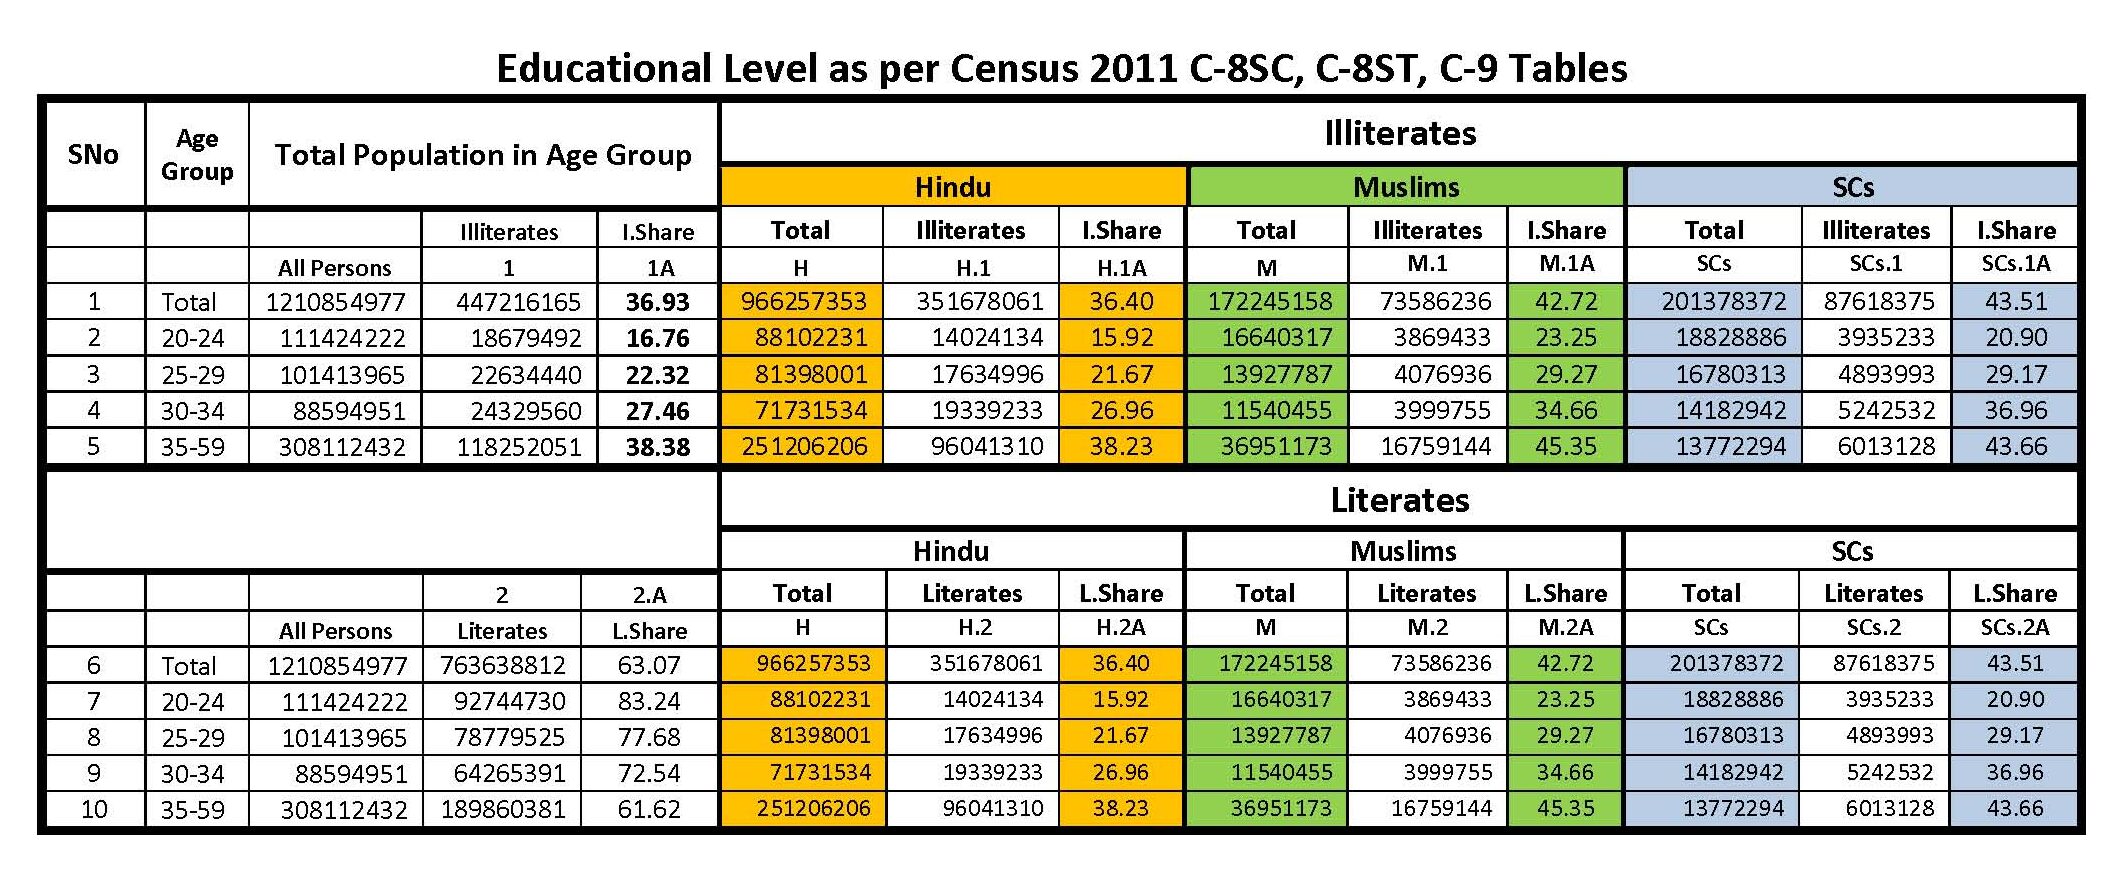
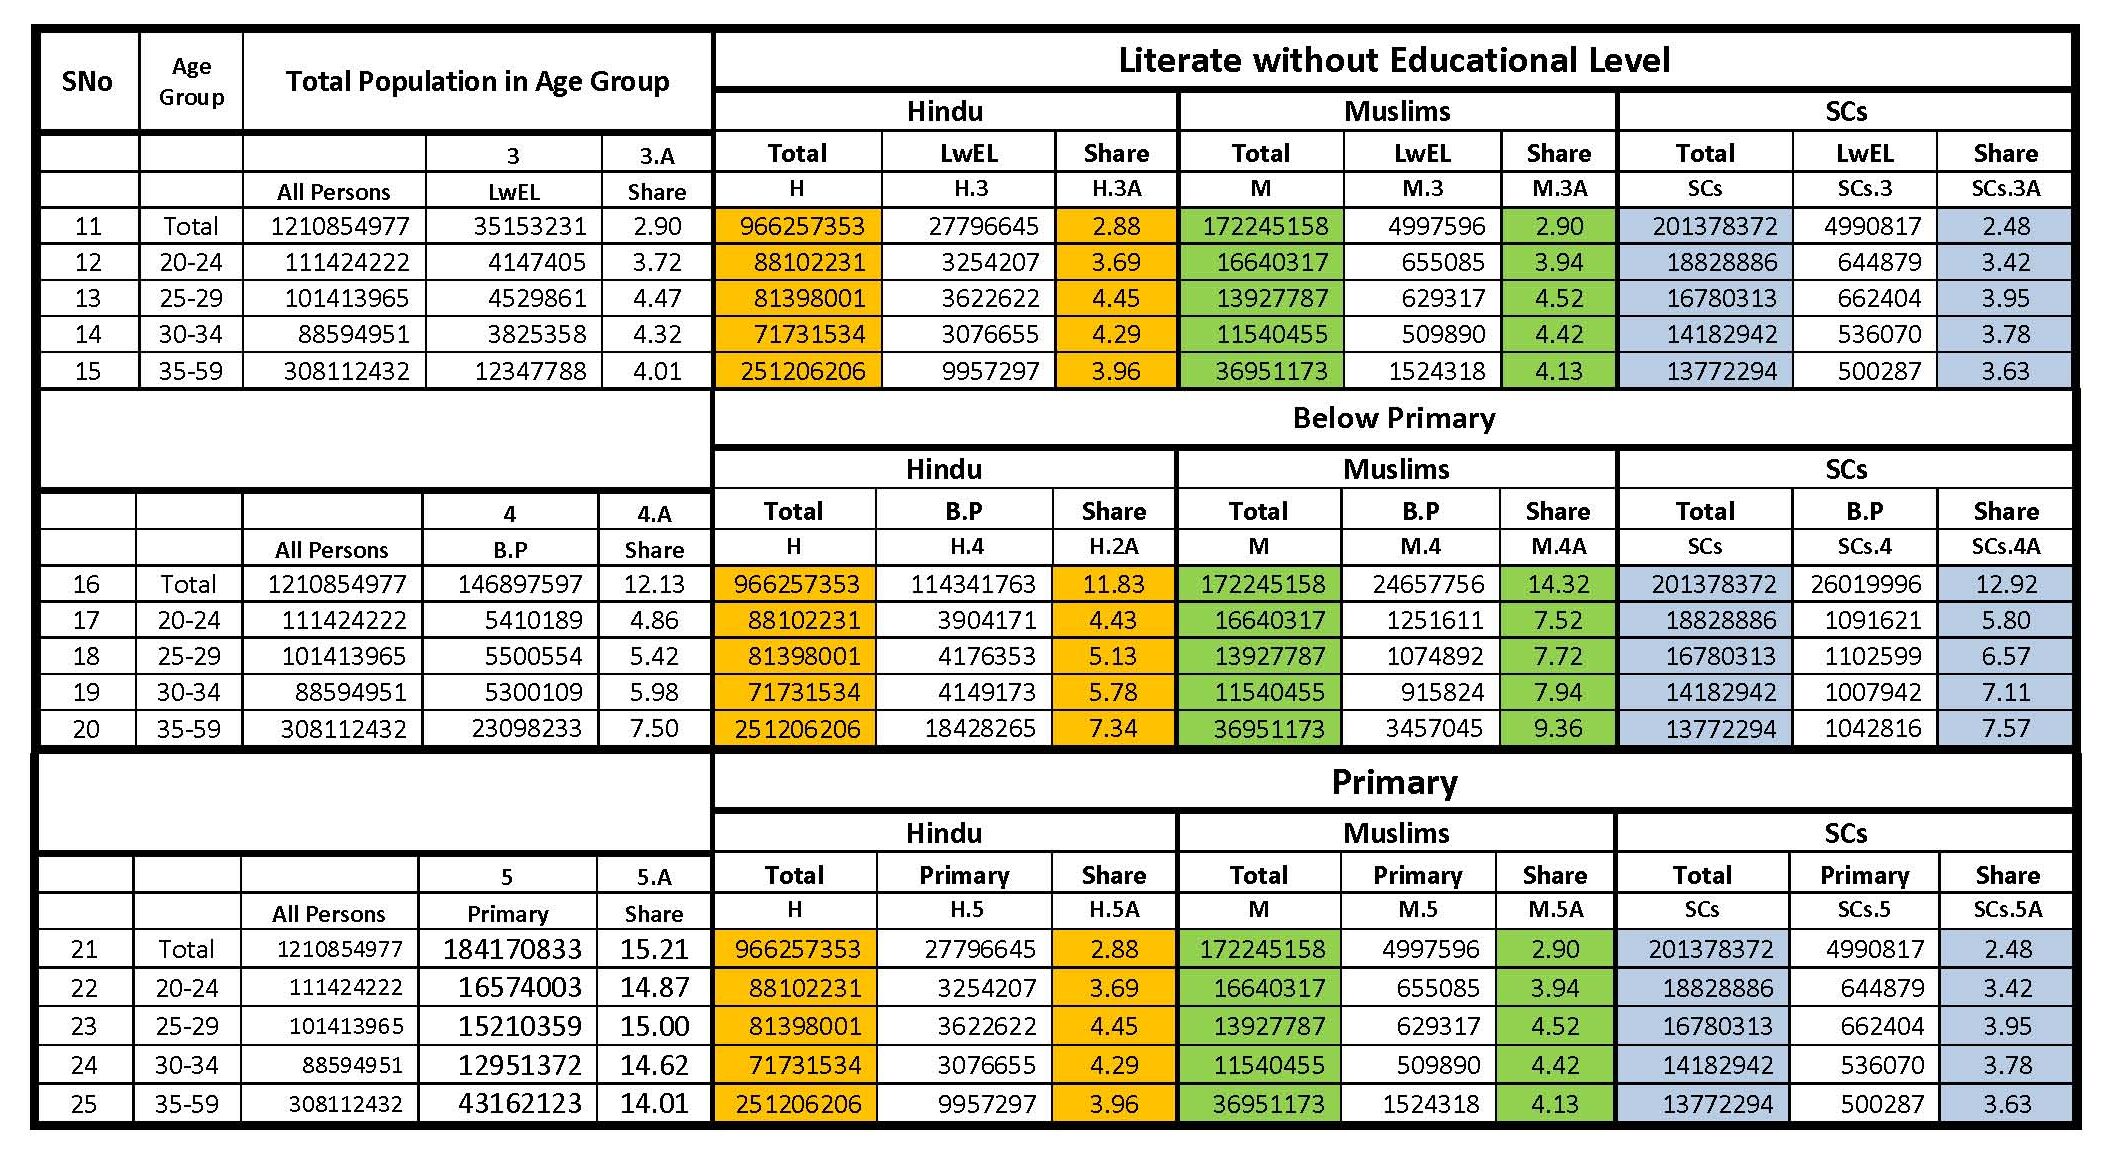
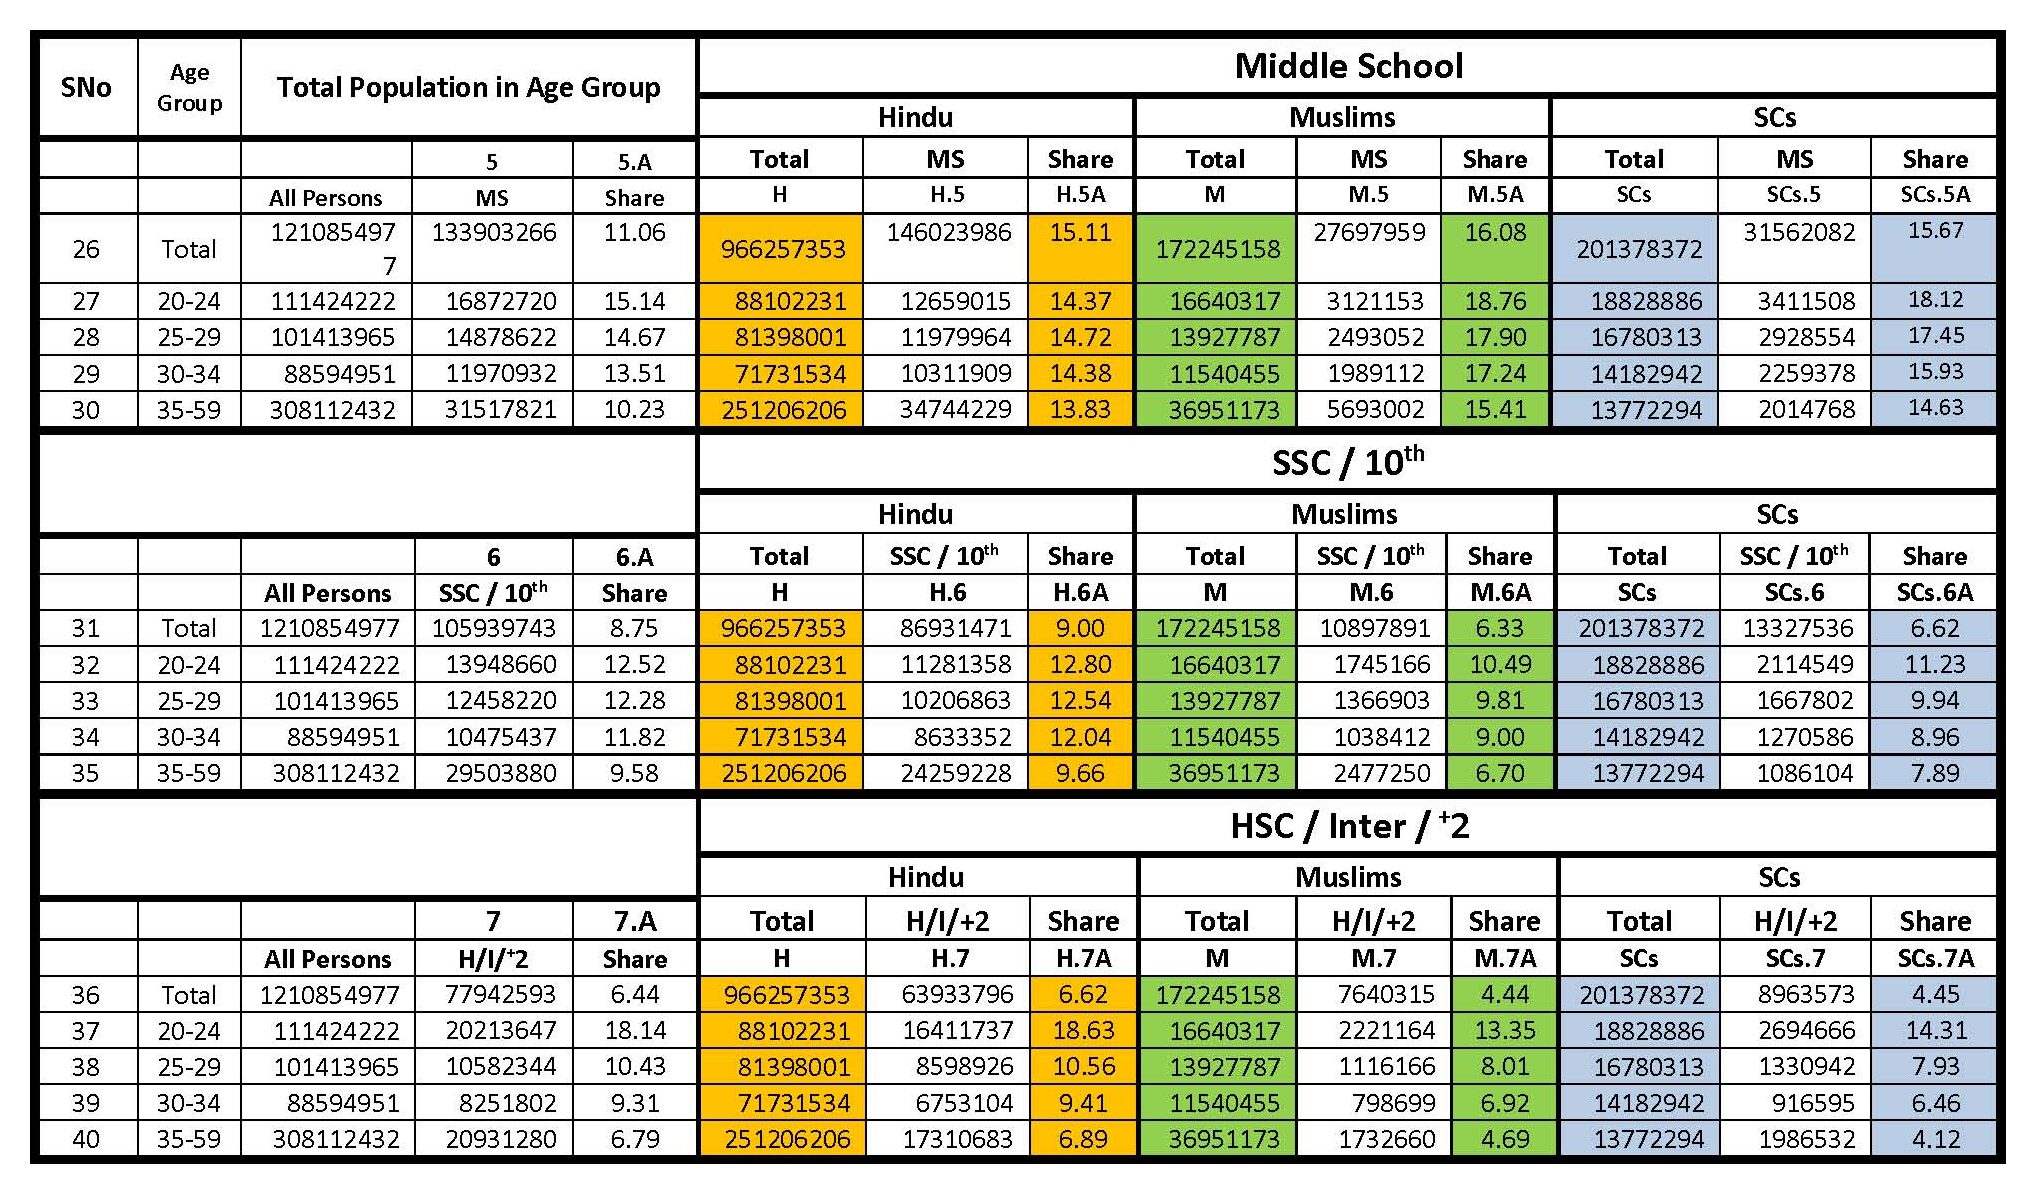
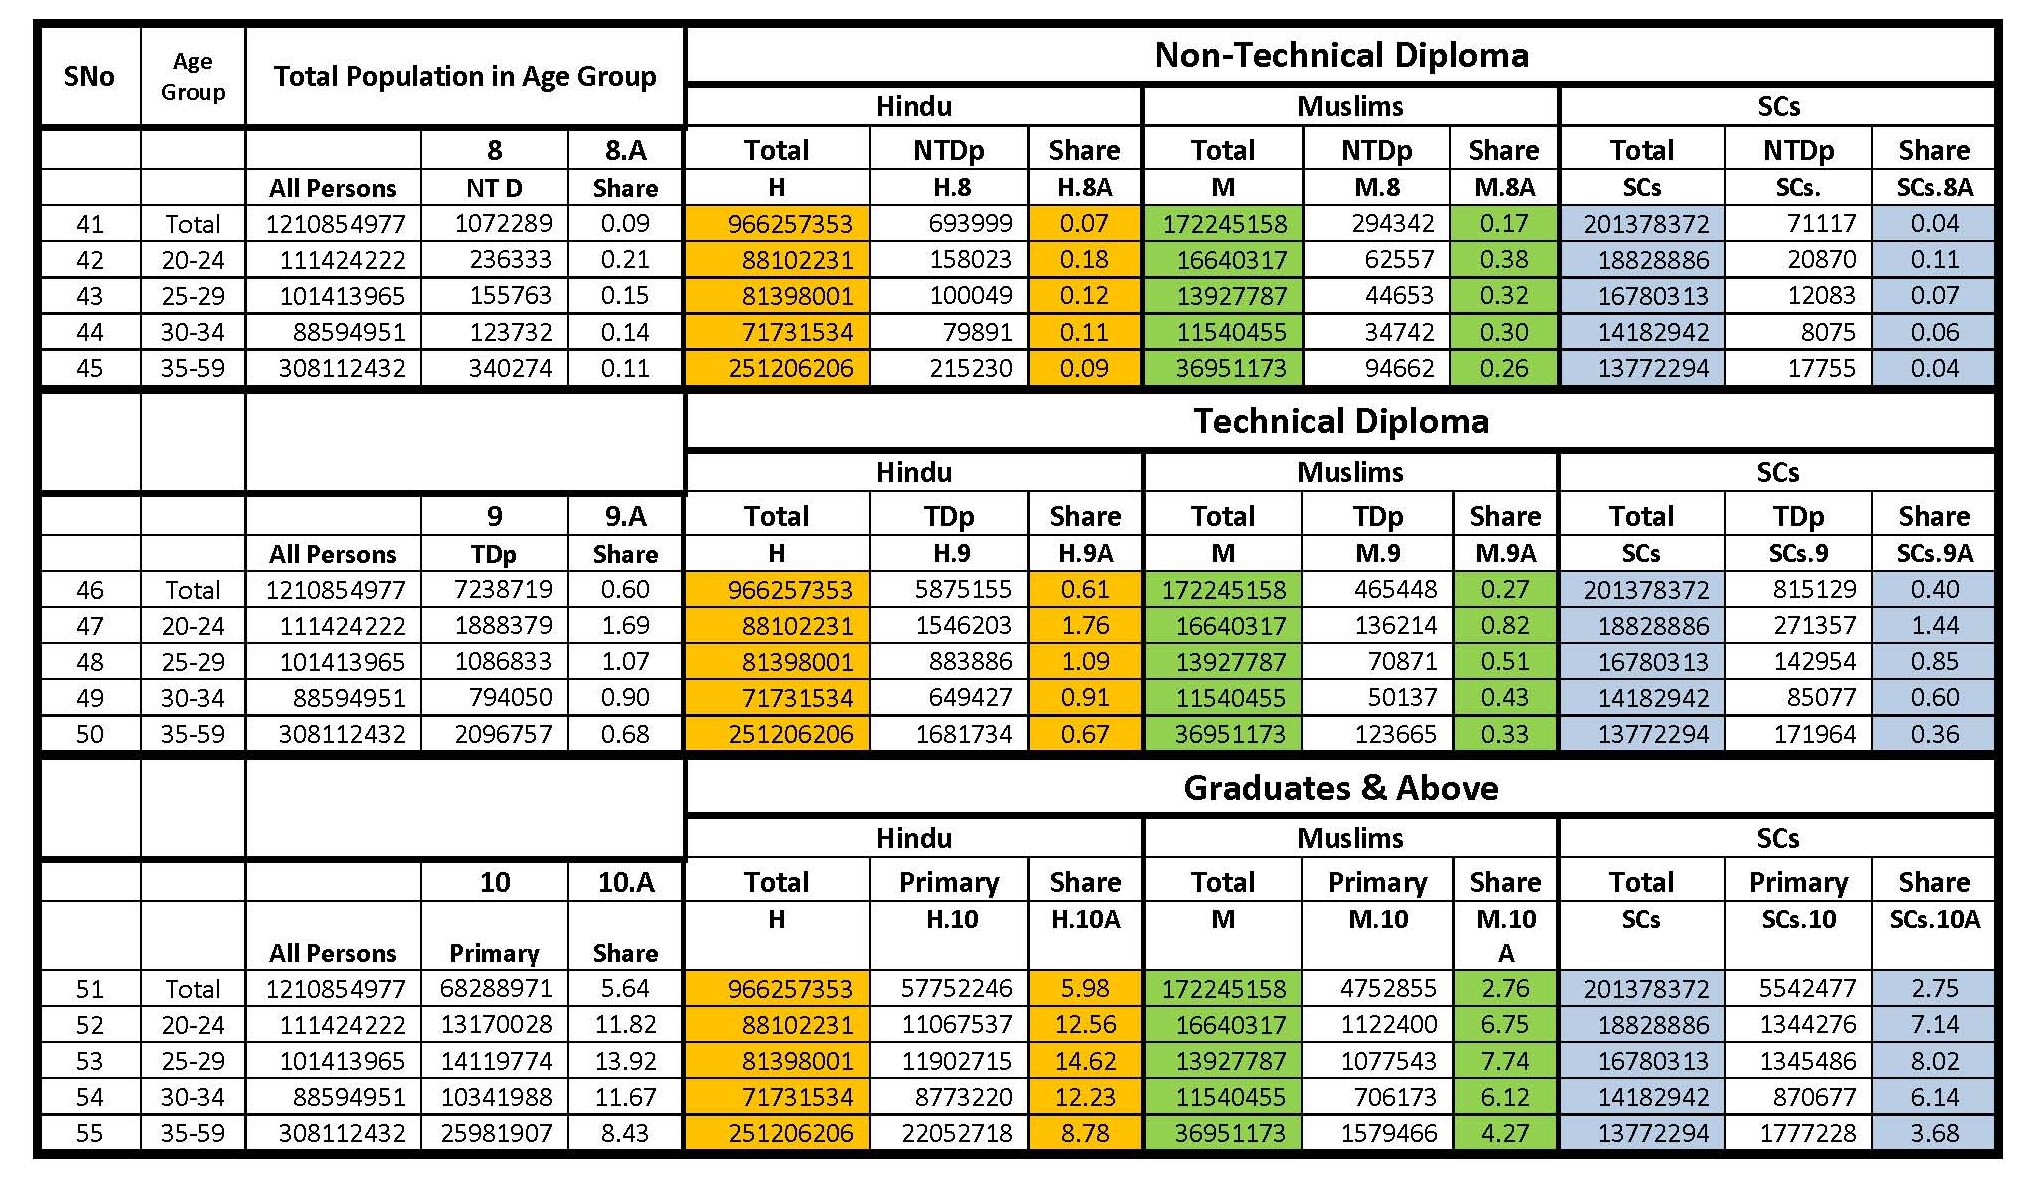
The following table on education level from Census 2011 gives many insights that need to be evoked as policies, budgetary allocations, necessary enactments, etc.
Educational Level as per Census 2011 C-8SC, C-8ST, C-9 Tables
However, the quality of education in India is poor as assessed by Pratham, an NGO that releases its report every year other than GOI. “Only about half of all children enrolled in Grade 5 could read at least Grade 2 level and do basic arithmetic operations, as per the national figures from ASER 2018.” More than one million teaching posts being vacant in the country at different levels other than the posts filled with contract teachers has serious implications on quality of educational standards. The claims of becoming ‘Viswa Guru’ can only be possible not only with rise in the educational standards but also by making the curriculum compatible with skill demands of Global Economic Dynamics. Unfortunately, no such insight has been concretized in terms of policy beyond frequent announcements. The makers of Indian Constitution have this vision; hence it is a fundamental right but the ruling regimes took more than half century to bring an enactment, yet it is not known how many more years are needed to make it compatible with Global Economic Dynamics.
Conclusion
To understand the current state of education policy in India, one must trace the history of how education has been managed in the country, and look closely at the Seventh Schedule of the Indian Constitution. When the Constitution was formulated, ‘general education’ was a subject under the ‘State List’ in the Seventh Schedule — meaning, the state governments had exclusive powers to make laws and policies about education. The Seventh Schedule has three lists in detail that explains to which level the government has powers to make laws and policies about a subject — the Union List (exclusive powers to the Union government), the State List (exclusive powers to the state government), and the Concurrent List (both Union and state governments hold power). And while ‘general education’ was in the State List, ‘scientific or technical education’, ‘higher education’ and ‘research’ were in the Union List. The New Educational Policy-2020 is an attempt to encroach upon Article1 of the Constitution undermining the powers delegated to the states under the Seventh Schedule. Present regime talks more about Curricular framework rather than creating infrastructure, filling the gaps, budgeting to provide education to all the children equally.
Data of schools with variables of habitation, distance, number of children, class/community/caste of habitation, type of school, facilities in the school, etc. should be the demand from the social and community activists that will make the government to plan better schooling. Society needs to push for policies supported by budgeting that give free, compulsory, common schooling and universal education till certain level to all children irrespective of their economic status; which is a need to meet the Constitutional mandate under Article 15,16, 29, 30, 240, 241 and 342, other than the mandate of Central OBC Commission and State BC Commission and various child rights Commissions. Community-wise habitations data with schools is not available beyond SCs and STs. Data of Muslim habitations and OBC habitations are not available till date as Government of India continues to ignore court judgements, OBC Commission reports, demands of state governments and parliamentarians irrespective of the ruling regimes. The same ruling regimes using caste matrix during the process of elections in issuing tickets for the election to various legislative bodies is a clear dual standard. The overall deprivation of education of the marginalized communities beyond religious identity is the result of a mindset that acted at every level through many variables to keep education away from them. People should push the political parties and legislative bodies to have such policies and enactments to meet the Constitutional objective.
[1] See https://ncert.nic.in/pdf/programmes/AISES/8th_AISES_Concise_Report.pdf page 24.
[2] See https://ncert.nic.in/pdf/programmes/AISES/8th_AISES_Concise_Report.pdf page 35.
[3] See pages 10-13 of NCPCR Report at https://ncpcr.gov.in/showfile.php?lang=1&level=1&&sublinkid=2141&lid=2041
[4] See https://dashboard.udiseplus.gov.in/#/home
[5] See https://ncert.nic.in/pdf/programmes/AISES/8th_AISES_Concise_Report.pdf page 34.
[6] See Economic Survey 2020-21 Vol-2 page A 158 on wards
[7] See AISHE 2019-20 Report
[8] See AISHE 2019-20 Report, page 46.
[9] Figure 3.2 from Page 28 of CBGA Publication ‘ Budget in the Time of the Pandemic – An Analysis of Union Budget 2021-22’ is available at – https://www.cbgaindia.org/wp-content/uploads/2021/02/Budget-in-the-Time-of-Pandemic-An-Analysis-of-Union-Budget-2021-22.pdf
[10] See Q No 1696 Answered on 02032020